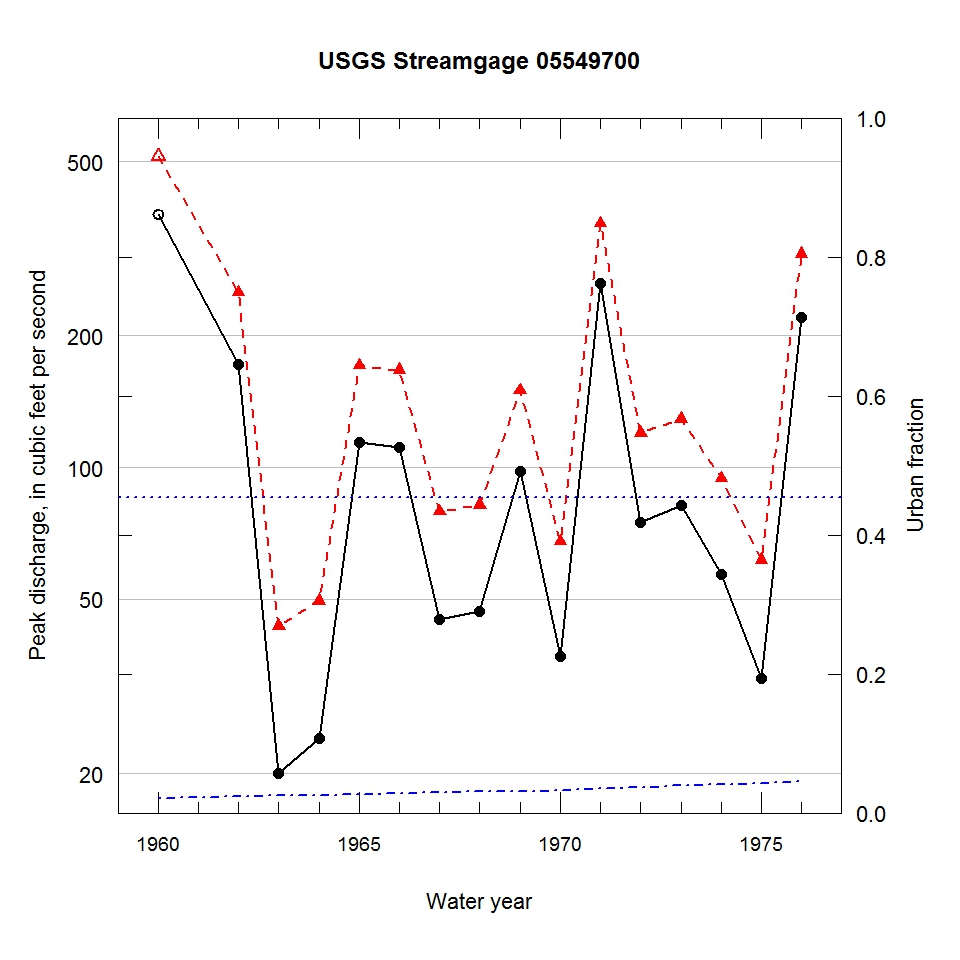
Observed and urbanization-adjusted annual maximum peak discharge and associated urban fraction and precipitation values at USGS streamgage:
05549700 MUTTON CREEK AT ISLAND LAKE, IL


| Water year | Segment | Discharge code | Cumulative reservoir storage (acre-feet) | Urban fraction | Precipitation (inches) | Observed peak discharge (ft3/s) | Adjusted peak discharge (ft3/s) | Exceedance probability |
| 1960 | 1 | 7 | 0 | 0.021 | 0.513 | 378 | 513 | 0.008 |
| 1962 | 1 | -- | 0 | 0.023 | 0.262 | 172 | 251 | 0.069 |
| 1963 | 1 | -- | 0 | 0.025 | 1.267 | 20 | 43 | 0.952 |
| 1964 | 1 | -- | 0 | 0.026 | 0.914 | 24 | 50 | 0.933 |
| 1965 | 1 | -- | 0 | 0.027 | 0.063 | 114 | 171 | 0.221 |
| 1966 | 1 | -- | 0 | 0.028 | 0.481 | 111 | 167 | 0.238 |
| 1967 | 1 | -- | 0 | 0.029 | 1.285 | 45 | 79 | 0.785 |
| 1968 | 1 | -- | 0 | 0.031 | 1.237 | 47 | 82 | 0.769 |
| 1969 | 1 | -- | 0 | 0.032 | 1.337 | 98 | 150 | 0.317 |
| 1970 | 1 | -- | 0 | 0.033 | 1.521 | 37 | 68 | 0.852 |
| 1971 | 1 | -- | 0 | 0.035 | 0.423 | 263 | 361 | 0.019 |
| 1972 | 1 | -- | 0 | 0.037 | 0.999 | 75 | 120 | 0.499 |
| 1973 | 1 | -- | 0 | 0.039 | 1.462 | 82 | 129 | 0.437 |
| 1974 | 1 | -- | 0 | 0.041 | 1.115 | 57 | 94 | 0.682 |
| 1975 | 1 | -- | 0 | 0.043 | 0.814 | 33 | 62 | 0.886 |
| 1976 | 1 | -- | 0 | 0.045 | 1.582 | 220 | 307 | 0.036 |

